Navigation
DISCLAIMER:
The nowcast/forecast system and other analyses/data are research
products under development. No warranty is made, expressed or implied,
regarding accuracy, or regarding the suitability for any particular application. All rights reserved University of South Florida, Ocean Circulation Lab.
Copyright University of South Florida 2010
Red Tide Prediction and Tracking on the West Florida Shelf
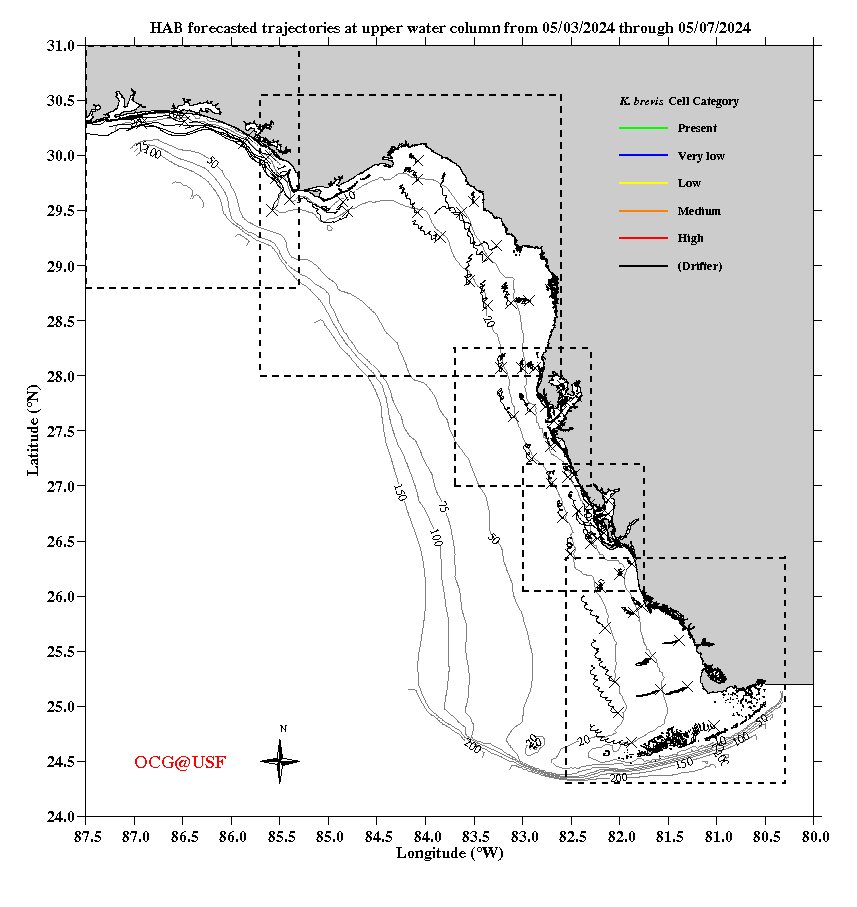
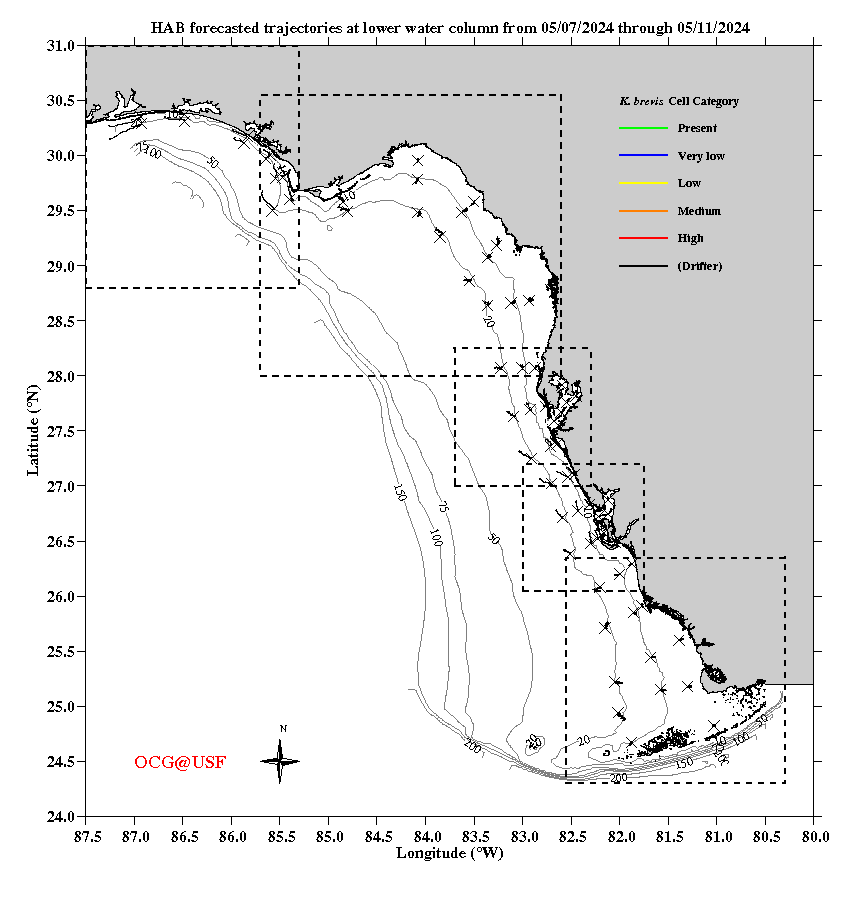
Click dashed-line boxes to zoom in sub-regions along the west Florida coast: from south to north, the Florida Bay, Charlotte Harbor, Tampa Bay, Big Bend and Panhandle regions. The "X" represents the starting point where each sample was collected. The lines show the 3.5 day trajectory for each sample. The color represents the red tide concentration for each sample. Black lines represent simulated drifter trajectories. If you see only black trajectories on the map, then there was likely no red tide observations or no red tide in the region in the last few days.
The College of Marine Science, University of South Florida (CMS-USF) provides seasonal predictions of major red tide events and short-term tracking of red tide once an event occurs. Seasonal prediction follows from the recognition that Karenia brevis red tide, of offshore origin, thrives under the low nutrient conditions generally found in the middle of the west Florida continental shelf (WFS). Conditions in successive years are generally not alike. When deeper ocean currents influence the WFS in certain ways, nutrients may be upwelled onto the WFS and carried toward the shore. If this occurs in spring to summer months, when K. brevis blooms tend to form offshore, other faster growing microscopic plants can prevail over the slower growing K. brevis, thereby suppressing red tide bloom development. By keeping track of Gulf of America currents, we can account for the occurrence or lack of major red tide blooms for 20 out of 25 years in which concurrent ocean currents and red tide data are available. As examples, 2010 experienced no red tide, 2012 was severe, whereas 2013 was only nominal. All subsequent years experienced major blooms, although 2016 provided an outlier, a year when we thought that there would not be a major bloom when one indeed occurred.
Once a bloom occurs, the Florida Wildlife Research Institute (FWRI) conducts K. brevis sampling and provides cell count observations to the CMS-USF team. The USF team then inputs these into an ocean circulation model to forecast where these cells may go over the next 4.5 days. With the cell counts a day old when received, the forecast consists of a 1-day hindcast followed by a 3.5-day forecast using our daily, automated West Florida Coastal Ocean Model (WFCOM). The "X" represents the starting point where each sample was collected. The lines show the 3.5 day trajectory for each sample. The color represents the red tide concentration for each sample. Black lines are not indicative of red tide; instead, they show where the current would take a simulated buoyant particle. These may be useful for search and rescue, or for tracking hazardous spills. The short-term red tide trajectory forecast products (uppper and lower water columns) are updated daily in the early morning. Similar products have been developed for the Tampa Bay region using high resolution ocean circulation model.
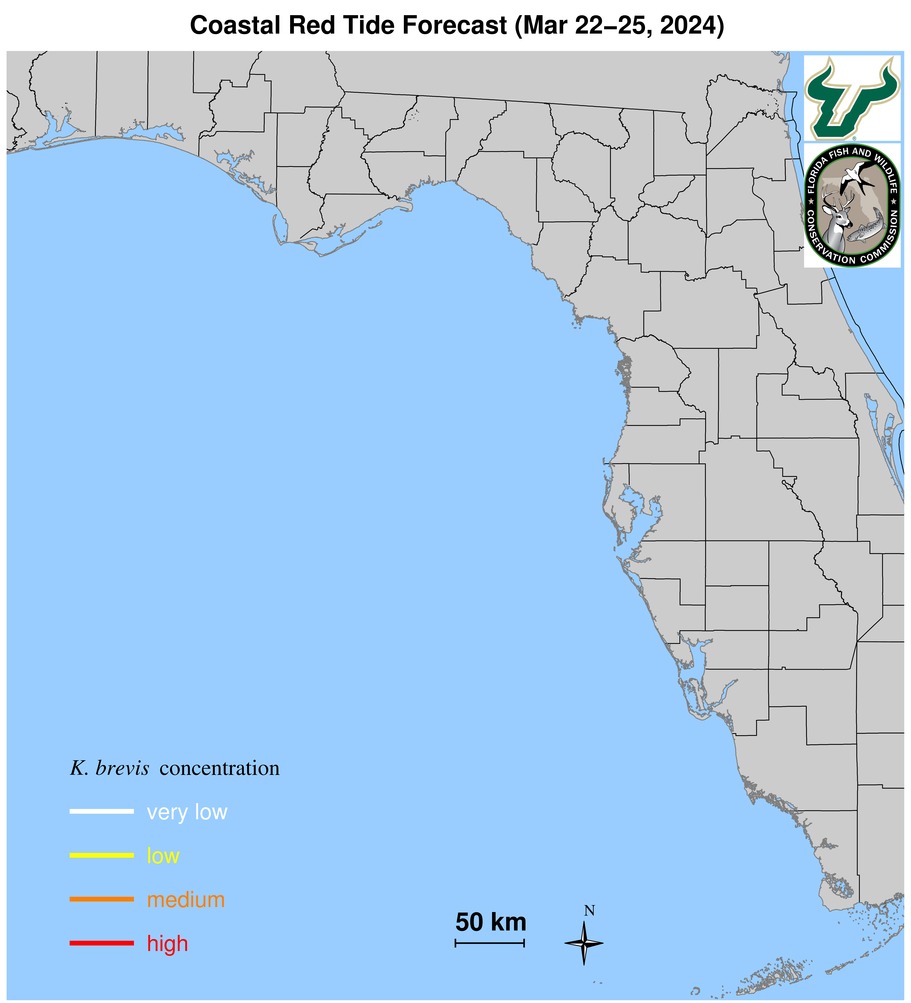
Given the short-term forecasts and the recognition that the spatial sampling is limited, blooms may be patchy, and trajectory forecasts include errors, we further produce a more general and user-friendly map to show where a red tide bloom may occur along the coast over the next several days. This product is updated every Wednesday and Friday.
References:
Liu, Y., Weisberg, R.H., Zheng, L., Hubbard, K.A., Muhlbach, E.G., Garrett, M.J., Hu, C.,
Cannizzaro, J.P., Xie, Y., Chen, J., John, S., Liu, L.Y. (2023),
Short-term forecast of Karenia brevis trajectory on the West Florida Shelf,
Deep-Sea Research Part II, 212, 105335, https://doi.org/10.1016/j.dsr2.2023.105335
Liu, Y., Weisberg, R.H., Zheng, L., Heil, C.A., Hubbard, K.A. (2022),
Termination of the 2018 Florida red tide event: A tracer model perspective,
Estuarine, Coastal and Shelf Science, 272, 107901, https://doi.org/10.1016/j.ecss.2022.107901
Weisberg, R.H., Liu, Y., Lembke, C., Hu, C., Hubbard, K., Garrett, M. (2019), The coastal ocean circulation influence on the
2018 West Florida Shelf K. brevis red tide bloom, J. Geophys. Res. Oceans, 124, 2501-2512, https://doi.org/10.1029/2018JC014887.
Liu, Y., R.H. Weisberg, J.M. Lenes, L. Zheng, K. Hubbard, and J.J. Walsh (2016),
Offshore forcing on the "pressure point" of the West Florida Shelf: Anomalous upwelling and its influence on harmful algal blooms, J. Geophys. Res. Oceans,
121, 5501-5515, http://dx.doi.org/10.1002/2016JC011938.
Weisberg, R.H., L. Zheng, Y. Liu, A.A. Corcoran, C. Lembke, C. Hu, J.M. Lenes, and J.J. Walsh (2016),
Karenia brevis blooms on the West Florida Shelf: A comparative study of the robust 2012 bloom and the nearly null 2013 event, Cont. Shelf Res., 120, 106-121, http://dx.doi.org/10.1016/j.csr.2016.03.011.
Weisberg, R.H., L. Zheng, Y. Liu, C. Lembke, J.M. Lenes, and J.J. Walsh (2014),
Why no red tide was observed on the west Florida continental shelf in 2010, Harmful Algae, 38, 119-136, doi:10.1016/j.hal.2014.04.010.
Zheng, L.Y., and R.H. Weisberg (2012),
Modeling the west Florida coastal ocean by downscaling from the deep ocean, across the continental shelf and into the estuaries, Ocean Modell., 48, 10-29, doi:10.1016/j.ocemod.2012.02.002.
Acknowledgements
The FVCOM HAB tracking tool has benefited from several sources of funding beginning with the FWC and USF. Additional resources from ONR, NOAA and NASA have helped advance the modeling effort over the years. Current support is by NOAA/IOOS/SECOORA, NOAA/USF COMIT, NOAA/ECOHAB, State of Forida through FWC/FWRI, and Florida DEP.
HAB Tracking
-
[an error occurred while processing this directive]