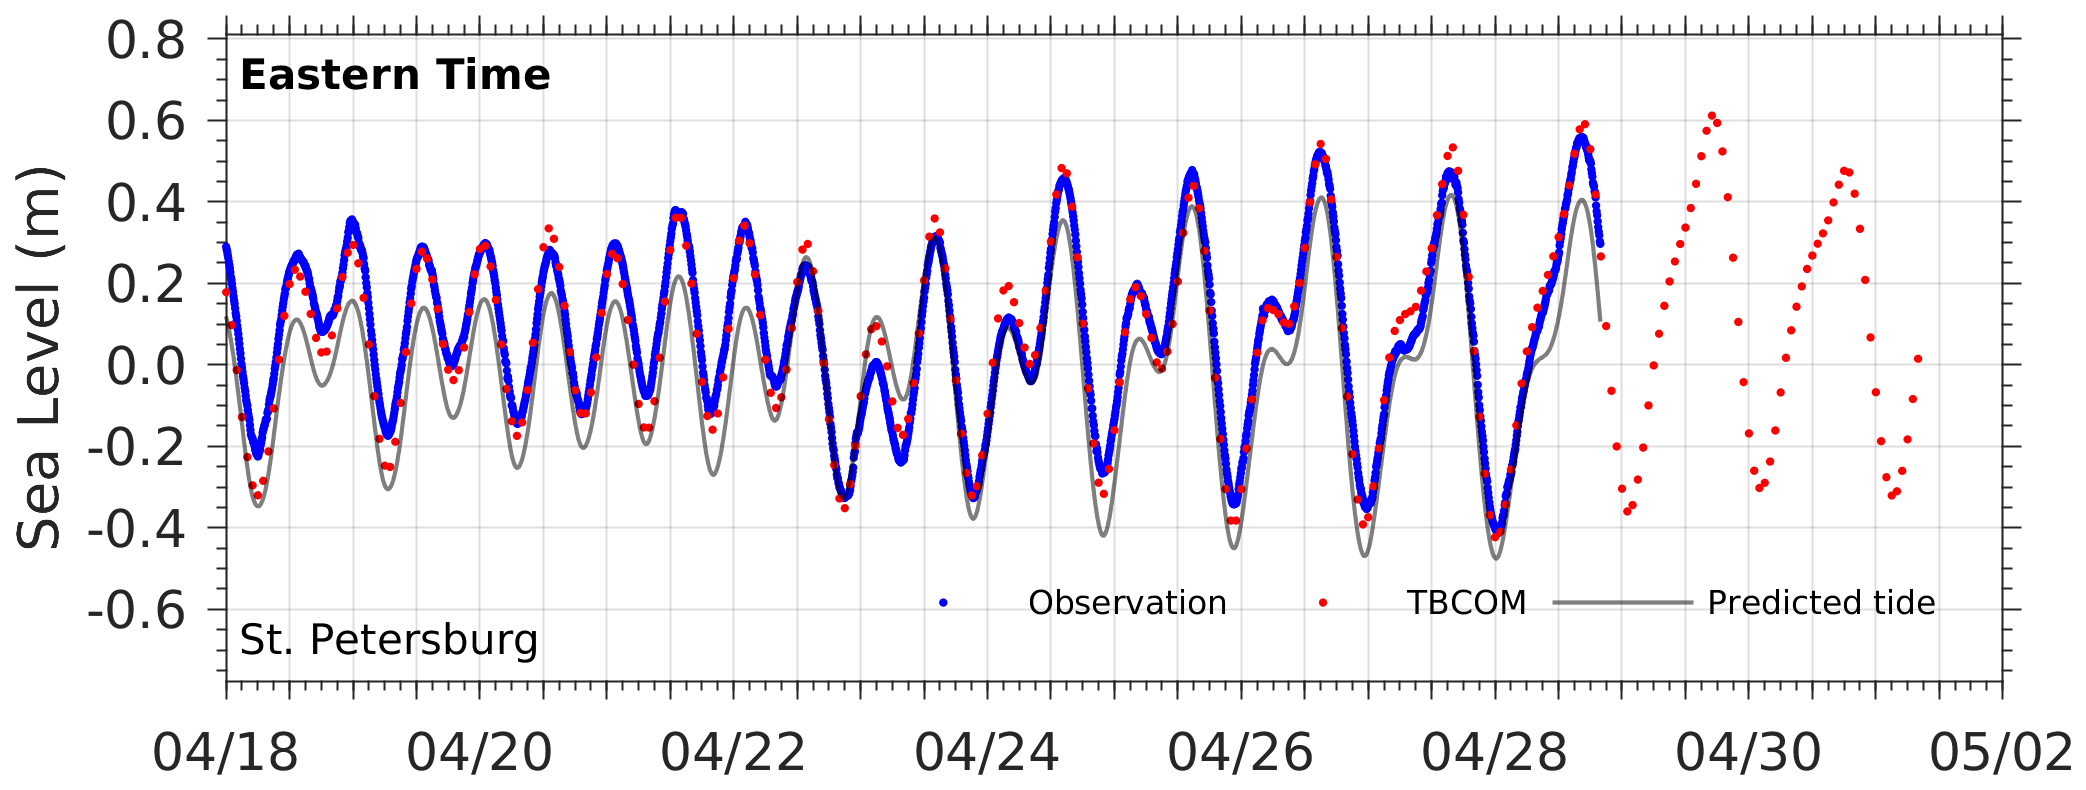
Sea Level in St. Petersburg

Comparisons of TBCOM simulated (red dots) and observed (blue line) water level time series. Also shown is the "predicted tide" water level time series reconstructed from the major tide constituents (grey line).
Disclaimer: The analyses/data are research products under development. No warranty is made, expressed or implied, regarding accuracy, or regarding the suitability for any particular application. All rights reserved University of South Florida. Copyright University of South Florida 2022.

