Seasonal Prediction of Major Red Tide Events on the West Florida Shelf
|
It is known that satellite optical sensors may be used to monitor red tide from the space if the sky is clear. Use satellite altimetry (sea surface height) data to predict major red tide. Are you serious? Yes, here is how it works. Karenia brevis red tide, of offshore origin, thrives under the low nutrient conditions generally found in the middle of the west Florida continental shelf (WFS). Conditions in successive years are generally not alike. When deeper ocean currents influence the WFS in certain ways, nutrients may be upwelled onto the WFS and carried toward the shore. If this occurs in spring to summer months, when K. brevis blooms tend to form offshore, other faster growing microscopic plants can prevail over the slower growing K. brevis, thereby suppressing red tide bloom development. Gulf of Mexico Loop Current (LC) interactions with the WFS slope play an important role in shelf ecology through the upwelling of new inorganic nutrients across the shelf break. This is particularly the case when the LC impinges upon the shelf slope in the southwest portion of the WFS near the Dry Tortugas. By contacting shallow water isobaths at this "pressure point" the LC forcing sets the entire shelf into motion. If this ocean circulation pattern persist, the upwelling circulation brings lots of new nutrients from the deeper ocean onto the shelf. If red tide cells have already formed offshore then these can be transported onshore by the upwelling circulation. However, if the upwelling conditions persist during the formative season then the nutrient input via upwelling from offshore may suppress K. brevis growth because it is outcompeted by other faster growing plants. Liu et al. (2016) use the Self-Organizing Map, an unsupervised neural network technique, to identify such Loop Current patterns and their cumulative duration of occurrences from more than two decades of satellite altimetry data. This serves as an indicator of offshore forcing of anomalous upwelling. Given its consistency in hindcasting the occurrence of (or lack of) severe WFS coastal blooms in 20 of 25 years for which joint altimetry and cell count data exist, the offshore forcing index may serve as a seasonal predictor for major K. brevis blooms on the WFS. Using this index, it is predicted that 2018 may be a year of substantial red tide presence for the WFS coast. Detailed information can be found in Liu et al. [2016]:Liu, Y., R.H. Weisberg, J.M. Lenes, L. Zheng, K. Hubbard, and J.J. Walsh (2016), Offshore forcing on the "pressure point" of the West Florida Shelf: Anomalous upwelling and its influence on harmful algal blooms, Journal of Geophysical Research: Oceans, 121, 5501-5515, https://doi.org/10.1002/2016JC011938. For the latest red tide information on the West FLorida Shelf and the short-term trajectory forecast , check our short-term red tide tracking tool, which is built upon our West Florida Coastal Ocean Circulation Model (WFCOM) nowcast/forecast currents. A similar product is also deveoped for the Tampa Bay region using our very high resolution Tampa Bay Circulation Model (TBCM) nowcast/forecast currents. |
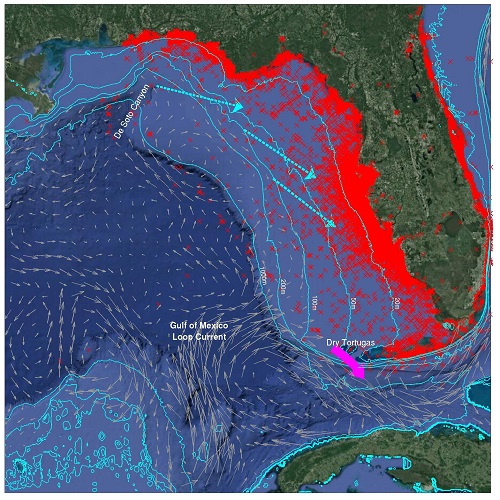
Locations of in situ observations of K. brevis red tide in the Florida coastal region during 1953-2015 and a schematic map showing Gulf of Mexico Loop Current system impinging on the southwest part of the West Florida Shelf slope area and inducing anomalous upwelling on the shelf (Modified from Figures 1 & 2 of Liu et al. [2016]). |
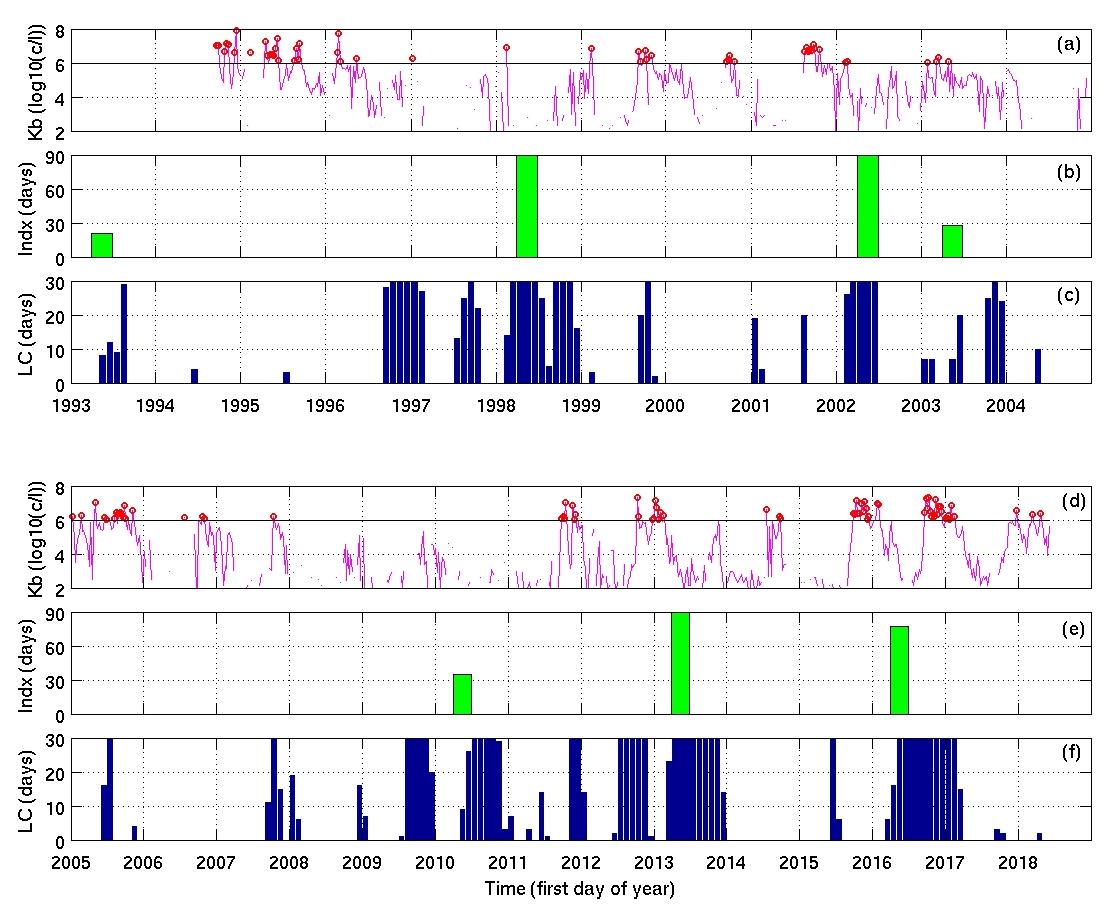
Occurrences of the red tide events on the West Florida Shelf and the offshore forcing at the "pressure point". (a, d) Weekly average of top five K. brevis cell counts (magenta lines) on the West Florida Shelf. The black thick line indicates the threshold of a major red tide bloom (1 million cells per liter sea water), and the cell counts exceeding this threshold are indicated as red circles. (b, e) The offshore forcing index (green bars) of Loop Current impinging on the southwest part of the shelf, defined as the cumulative number of days that SOM pattern 15, 16, 18, 19, or 20 occurred during early summer (1 April through 30 June) for at least 2 months with at least 7 days in each of the months. (d, f) The number of the days that SOM patterns 15, 16, 18, 19, and 20 occurred in each month (blue bars) (Adapted from Figures 6 of Liu et al. [2016]).
See Yonggang Liu's publications
Back to Yonggang Liu's homepage
(Last updated on 08/31/2018)